Data Visualisation, A Powerful Tool.
In an era of technology, big data and customer personalisation, much more is expected of our brands and retailers. This is where data visualisation and mapping can be a great benefit.
Businesses need to eeke out every penny of their budgets, making their spend count by improving efficiency and getting a better return on investment. This falls across a wide range of job roles from the bottom up. Data analysts, insight directors, channel & category managers, brand managers, new product development and sales territory and planning functions.
Data Mapping Unlocks Insights
In projects where large amounts of data need to be analysed, providing the insight and intelligence to determine strategy, data visualisation is a great tool to help unlock insights. Not only that, but visualisation of complex data is easier to digest which often helps gain engagement internally more easily.
It is increasingly important for retailers and brands to understand the vast amounts of data at their disposal. Data insight helps businesses check they are aligned to current market demand and will help predict future trends. Marketing, Brand, Shopper and Category roles are often required to digest and understand patterns and trends within the wealth of data they can obtain for their brands and products. The ability to measure and assimilate this information in an easily comprehensible way to allow informed marketing or operational decisions is very powerful. This is where data visualisation through mapping comes into its own.
Data Visualisation Mapping
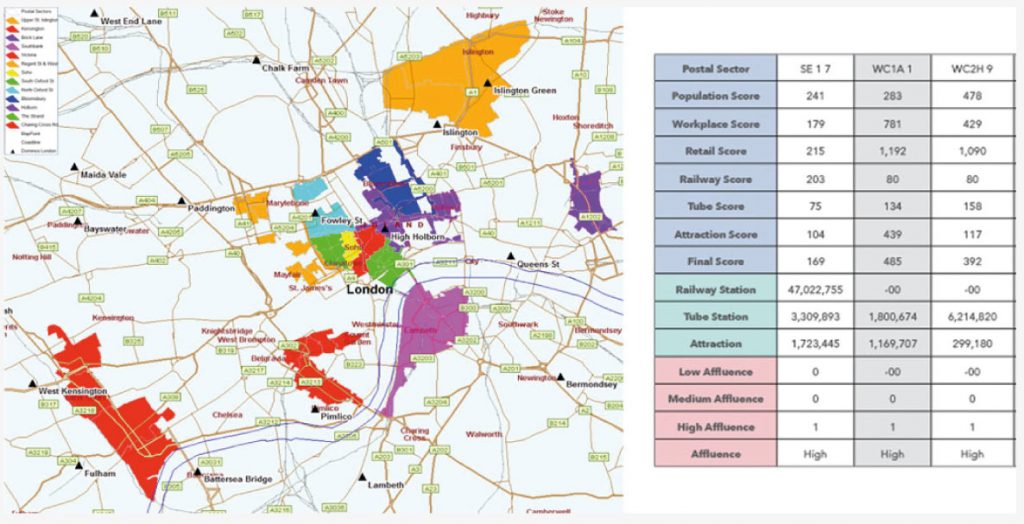
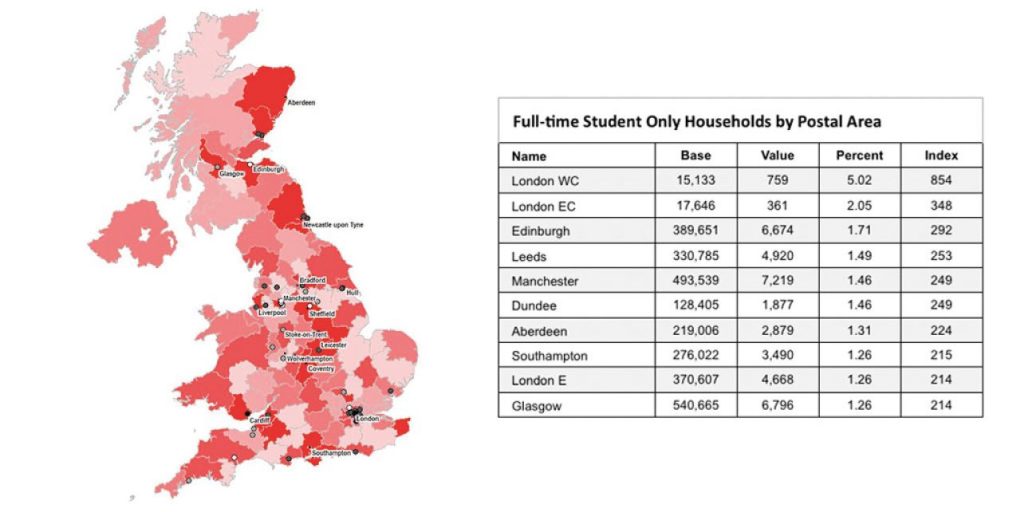
Mapping and analytical software can help companies recognise the impact that geography and location have on the buying process. It can also help better understand the dynamics of your offering within the context of the wider marketplace. The ability to import store locations or indeed individual clients/customers by product or spend enables you to visualise any spatial distribution of behaviour in terms of spend and frequency. Hot/cold mapping layering density of spend or client/customer purchase, can be powerful indicators of market penetration or highlight areas under or overpopulated in relation to the market, competitors or opportunity available.
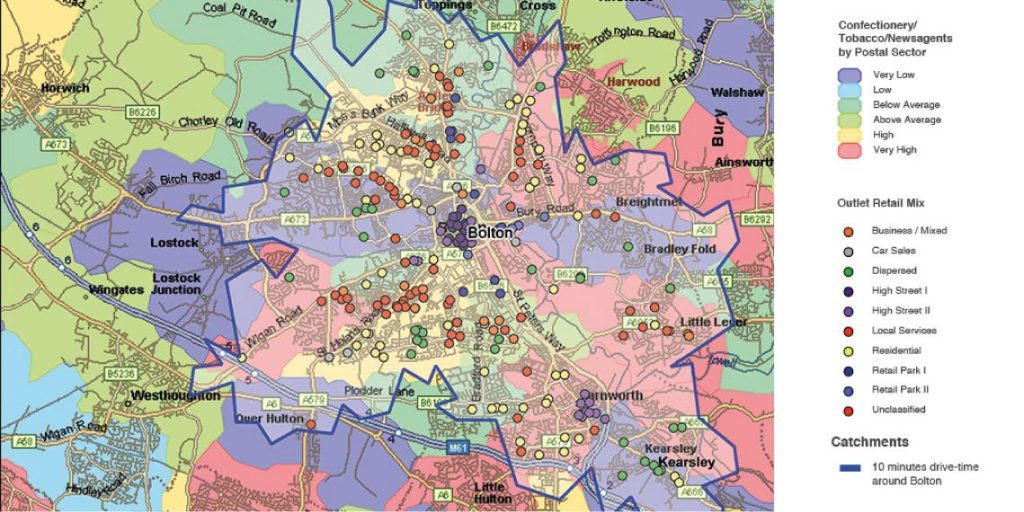
Drive-Time Analysis
Customer Hot Spots
Heat Mapping
Lastly mapping of data in terms of social demographics, retail demographics, types of businesses within your catchment or retail competitors can all build a picture of how the market is influencing performance of a store, area or region. Marketview is an example of such a tool as it enables data mapping, reporting and analytics.
Data is powerful when it can be digested and understood. Those that can decipher spread sheets of data are a rare breed, but for the rest of us, software that can help ease and assimilate powerful information is a godsend. Having a tool that can help us make sense of vast amounts of data and interpret the results can make us more effective and efficient in our roles. The ability to make informed marketing or operational decisions is essential in today’s competitive market.
To learn more about our data mapping software please call 01926 887555 or email [email protected] to have a chat with a member of our team.
Read more